
Unveiling the power of the network tab in the developer console
Whilst working as a hobby developer working on my own small projects, I would have code littered with console.log() messages, outputting various things to help me solve bugs with various things, including network requests. Passing data and retrieving data. Whilst this helped find problems, it would be time-consuming, having to add in the code, restart the server and rerun requests etc. Then I found a tool hiding in plain sight in the developer console. THE NETWORK TAB.
Using the network tool gives you real time insights into your network requests, from seeing assets being loaded, to API calls. This offers several useful insights.
Debugging
When your app is sending network requests you can easily see all the information needed, request and response headers, status codes, request payloads and more. Using this information you can confirm that the expected values are being passed in the network request, without the need to put multiple console.logs() in your code.
In the following example a request is being made to the backend, instead of logging out details of the request, the network tab allows us to see the request details. Currently the request is returning a 500 status code showing an internal server error. The request payload shown below shows us the data being passed to the backend. We can see the payload contains the key query, but our backend server expects a key named query. So it returning the error.
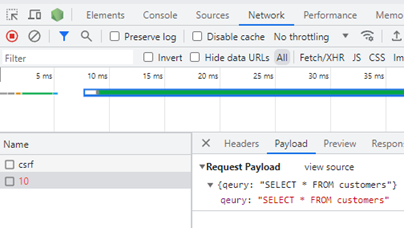
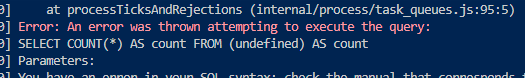
Our backend server also gives us an error, but it is not obvious why the error occurred,
We can see that the subquery is undefined, and with the additional help of the network we can see that we have misspelt query in our front-end code, so the value used by the server is now undefined.
We could achieve the same result using console.logs, but this clutters up the code, takes extra time and also runs a risk of leaving these in the code which in turn will clog up logs when debugging in production.
Performance optimisation
In a world where users want fast loading websites and apps, A large image being loaded can really affect load times leading to user frustration. The network tab shows all the information you need to identify any of these assets, you can identify the suspect and if required compress the image to give fast load times. You can also spot any unnecessary requests being sent and remove these.
Whilst loading this webpage that contains a lot of images, the page is loading for a long time, from the network tab we can view what is being loaded and the time and seize of each individual item.

Learning and development
As a junior developer, the network tab has been an invaluable tool for learning how websites work under the hood, picking up on issues with network requests such as incorrect data in payloads. Whilst using the network tab, you can also throttle the network speed, choosing from various options such as slow 3g connection, offline or even create your own custom options.
In conclusion, the network tab is a powerful ally for developers. It empowers developers, both experiences and novices to optimize performance, enhance security and streamline their debugging process. However you’re working with the web, don’t overlook this powerful tool. Unlock the secrets of the web, one request at a time.
Search
Authors